
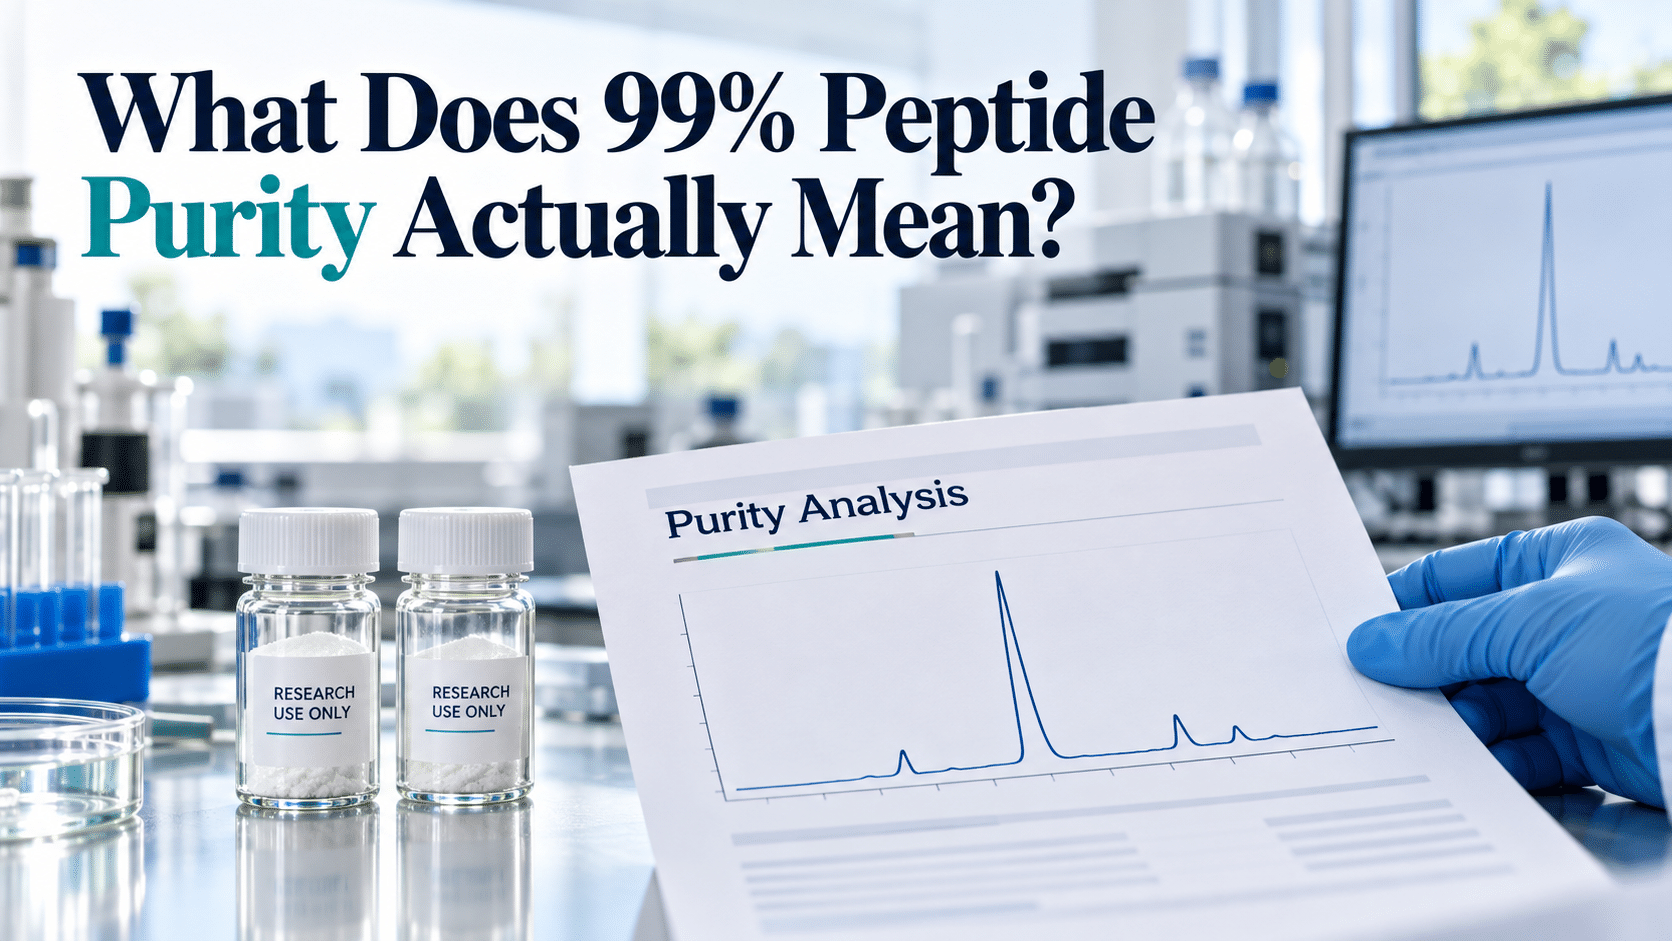
“99% purity” looks like a straightforward description of a research peptide. It can suggest that almost everything in the vial is the intended compound. But that interpretation depends on what was measured.
When a supplier reports 99% purity by HPLC area, the figure generally describes the target peak’s share of the included chromatographic signal. It does not automatically mean that 99% of the material’s total weight is the intended peptide.
To interpret the figure properly, distinguish chromatographic purity, peptide content and the amount of the target compound. This guide explains those measurements, with illustrative calculations for laboratory purchasing and research planning.
First, ask “99% of what?”
The word “purity” should come with a method and a reporting basis. HPLC area percentage, a quantitative assay and a mass-fraction assignment are not interchangeable labels.
For an HPLC area result, the calculation has the following general form:
Target peak area ÷ total peak area included in the calculation × 100
The method and processing rules determine which signals are included. In a Waters application study on synthetic peptide impurity reporting, peak-area percentages and reporting thresholds are explicitly part of the analysis.[1]
A simple chromatographic example
Suppose the included peak areas total 100,000 arbitrary units, of which 99,000 are assigned to the target peptide. The calculated target area is 99%.
That calculation is correct for the stated signals. It does not weigh the whole sample or account automatically for substances that the method does not detect or include. The numbers in this example are fictional and illustrate the calculation only.
Purity, content and quantity answer different questions
| Measurement | Question it addresses | What you should not assume |
|---|---|---|
| Chromatographic purity | How much of the included chromatographic response is attributed to the target component? | That the result is also its percentage by total sample weight |
| Net peptide content | What fraction of the material is peptide material, rather than non-peptide constituents? | That every peptide present is the intended sequence |
| Target-peptide amount or concentration | How much of the intended compound is present, on a defined measurement basis? | That an advertised fill quantity has necessarily been independently measured |
Sigma-Aldrich explicitly separates HPLC purity from peptide content. Its technical explanation notes that water and salts are not accounted for by the HPLC purity result.[2]
Bachem also explains that net peptide content can include peptide-related impurities.[3] It therefore needs interpreting alongside evidence about which peptide species are present.
If a report uses terms such as “assay”, “content” or “net amount”, check the issuer’s definition. Similar words can describe different measurements on different certificates.
Why a highly pure peptide can have lower peptide content
The dry material in a container may include the target peptide, related peptide species, counterions, moisture and other residual components. Some of these contribute to the material’s weight without being represented by the same analytical purity calculation.
Counterions are associated with the peptide’s salt form. Bachem describes how salt formation and moisture can lower net peptide content even when chromatographic purity is high.[3]
A content result below 100% therefore does not, by itself, demonstrate poor manufacture or deliberate dilution. Equally, it should not be ignored: the salt form, amount of water and any other relevant constituents still need to fit the specification and intended experiment.
What measurement laboratories actually assess
In the BIPM-coordinated CCQM-K115.b comparison involving synthetic oxytocin, participants using a mass-balance approach assessed related peptide impurities, water, residual organic solvents and other non-volatile components separately.[5]
For that particular comparison material, the report gave a combined water mass fraction of 63.3 mg/g and a trifluoroacetic acid mass fraction of 103.9 mg/g, each with a stated uncertainty. Those are approximately 6.33% and 10.39% by mass. They are study-specific findings, not typical values to assume for a purchased product.
The useful lesson is methodological: rigorous characterisation distinguishes different contributions to the sample’s mass instead of expecting one chromatographic number to describe everything.
Worked example: 99% purity and 80% peptide content
This example is hypothetical. It does not describe a Coridion product or establish the amount in any real vial.
Assume a laboratory has suitable results for the following simplified calculation:
| Input | Illustrative value |
|---|---|
| Gross dry material, excluding the container | 10 mg |
| Net peptide content | 80% |
| Target-peptide fraction within the peptide material | 99% |
The estimated target-peptide amount is:
10 mg × 0.80 × 0.99 = 7.92 mg
This follows the content-and-purity calculation illustrated in Bachem’s technical FAQ.[4] It assumes compatible measurements and a justified use of the purity result for estimating the target fraction. A raw UV area percentage is not automatically an exact mass fraction; detector response and the analytical approach matter.
For real material, obtain the supplier’s calculation basis or a suitable quantitative assay. Do not insert an assumed 80% content because another peptide or batch had that value.
Does this mean a vial labelled “10 mg” is underfilled?
Not necessarily. The label might refer to gross material, a quantity corrected for peptide content, or another specified basis. The example does not establish which convention a supplier uses.
Ask what the labelled amount represents and which batch-specific data support it. If the supplier already reports a corrected target-peptide amount, applying another content correction could count the adjustment twice.
Why purity and water percentages may appear to exceed 100%
Imagine a report showing “HPLC purity: 99%” and “water: 5%”. Adding those numbers gives 104%, but the addition is inappropriate if the percentages use different denominators.
The HPLC result describes the relevant chromatographic response; the water result may describe a proportion of the sample’s mass. They are not automatically two slices of the same whole.[2]
For the same reason, do not subtract water from chromatographic purity to obtain the target-peptide content. Ask for measurements and a calculation that use a compatible basis.
Does 99% purity mean the other 1% has been identified?
No. In an area-normalised chromatographic result, the remainder represents the other signals included in that calculation. Their chemical identities may or may not have been established.
Nor does the figure show that every relevant impurity has been separated and detected. ICH Q2(R2) discusses analytical specificity and selectivity, including using complementary procedures where one method cannot discriminate sufficiently.[6]
For an online peptide buyer, the question is whether the method adequately addresses the impurities relevant to the intended work. Request the impurity profile or supporting investigation when it matters to your protocol.
A single overall figure can also conceal differences between impurity profiles. Two samples with the same reported purity need not contain the same secondary components.
Is 99.9% necessarily better than 99.0%?
A higher result can indicate fewer detected impurities when samples are assessed using a suitable, comparable method. It does not establish overall superiority across unrelated reports.
Before comparing small differences, check that the reports concern the same compound and comparable methods, reporting thresholds and sample types. Also establish whether the difference is meaningful given the method’s performance.
Eurachem’s guidance on compliance assessment explains the role of measurement uncertainty when deciding whether results meet specifications.[7] Additional decimal places alone do not demonstrate stronger evidence.
Your laboratory may need information about a particular impurity, the target amount or formulation compatibility more urgently than a small increase in the headline purity result. Define those requirements before deciding what deserves a higher price.
What a high purity result does not establish
Several properties require separate evidence:
- Identity: Is the main component the intended peptide? Bachem’s quality-control guide treats identity and purity as separate analytical questions.[3]
- Quantity: How much target compound is actually present, and on what basis was that amount assigned?
- Microbiological quality: Were relevant tests performed? FDA guidance treats bacterial endotoxin testing as a distinct assessment with its own method considerations.[8]
- Stability: Does the evidence support the material’s stated storage conditions and period of use?
- Suitability for the experiment: Does the full specification meet the protocol’s requirements?
A chromatographic purity result also does not establish clinical safety or authorisation for human use. These are not conclusions that an analytical area percentage can support.
What to request when reviewing a purity claim
Keep the enquiry specific to the product and batch:
- The reporting basis: Is the figure HPLC area percentage, an assay result or another measurement?
- The applicable COA: Does it identify the batch being supplied and the sample tested?
- Supporting analytical information: What method, peak assignments and processing rules were used?
- Quantity and content information: What do the labelled milligrams represent, and are any corrections already included?
- Relevant additional results: Are identity, formulation, impurities or other characteristics covered to the extent the experiment requires?
For mixtures and pre-mixed solutions, ask how the analytical method deals with the individual components. A purity result for a starting ingredient cannot automatically be carried across to describe the complete formulation.
When considering research peptides from Coridion Sciences, request the information available for the exact product and format. The purchasing decision should rest on what the batch evidence establishes and how well that matches the planned laboratory work.
Common questions about peptide purity
Can 99% purity and 80% peptide content both be correct?
Yes. They can describe different aspects of the same material. The first may describe a chromatographic result; the second may describe the proportion of peptide material in the overall sample. Check how the laboratory defines and measures both.
Does a purity result measure the amount in every vial?
Not by itself. Establish what was sampled, whether quantity was measured and how the tested sample is linked to the supplied containers.
Can two batches with the same purity contain different target amounts?
Yes. Different gross quantities or peptide contents can produce different target amounts despite matching chromatographic purity figures. Use batch-specific information rather than transferring a calculation from a previous order.
Should I choose the highest advertised percentage?
Choose material that meets a justified specification supported by interpretable results. A higher percentage is useful only when you understand the measurement, can compare it fairly and know its relevance to the experiment.
Sources
- Waters. LC-UV-Based Synthetic Peptide Impurity Tracking and Reporting with Compliant-Ready Empower 3 Software, 2017. Primary application study illustrating peak-area reporting, processing thresholds and individual impurity criteria.
- Sigma-Aldrich. Peptide Sample Amount Determination. Technical explanation of purity, peptide content and their different measurement bases.
- Bachem. Quality Control of Amino Acids & Peptides: A Guide. Manufacturer-authored technical guidance on identity, purity, counterions and net peptide content.
- Bachem. Frequently Asked Questions, analytical data and calculation sections. Basis for the illustrative content-and-purity calculation; the article’s numerical inputs are fictional.
- BIPM / CCQM. CCQM-K115.b: Key Comparison Study on Peptide Purity—Synthetic Oxytocin. Original interlaboratory comparison report. The cited water and TFA results are specific to the comparison material and are reported with uncertainties; they are not a commercial-market survey.
- US Food and Drug Administration / ICH. Q2(R2): Validation of Analytical Procedures, specificity/selectivity sections. Cited for analytical principles, not to imply a particular supplier’s method has been validated to this standard.
- Eurachem / CITAC. Use of Uncertainty Information in Compliance Assessment, second edition, 2021. Guidance on interpreting measurement results against specifications.
- US Food and Drug Administration. Pyrogen and Endotoxins Testing: Questions and Answers, Edition 2, 2026. Cited to distinguish endotoxin assessment from chemical purity testing; not a prescription of pharmaceutical limits for research reagents.